BFS Questions
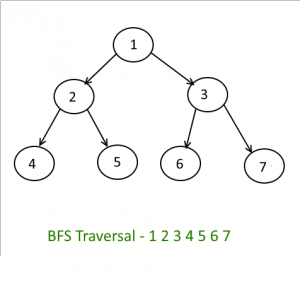
Implement Breadth-First Search
Write a Python function `bfs(graph, start_node)` that performs a Breadth-First Search on a given graph. The graph is represented as an adjacency list (a dictionary where keys are nodes and values are lists of their neighbors). The function should return a list of nodes in the order they were visited.
Visual Example:
# For the graph above:
graph = {
  'A': ['B', 'C'], 'B': ['A', 'D', 'E'],
  'C': ['A', 'F'], 'D': ['B'],
  'E': ['B', 'F'], 'F': ['C', 'E']
}
# Starting at node 'A'
Input: graph, 'A'
Output: ['A', 'B', 'C', 'D', 'E', 'F']
The traversal explores level by level: A, then B and C, then D, E, and F.
Shortest Path in a Grid
You are given an `n x n` binary grid. A `0` represents an open path, and a `1` represents an obstacle. Find the length of the shortest clear path from the top-left cell `(0, 0)` to the bottom-right cell `(n-1, n-1)`. A clear path can move in 8 directions (horizontally, vertically, and diagonally). If no such path exists, return -1.
Example:
Input: grid = [[0,0,0],[1,1,0],[1,1,0]]
Output: 4
DFS Questions
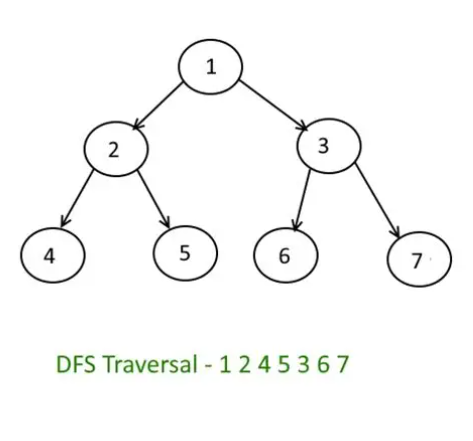
Implement Depth-First Search
Write a Python function `dfs(graph, start_node)` that performs a Depth-First Search on a given graph. The graph is represented as an adjacency list. The function should return a list of nodes in the order they were visited. You can implement this recursively or iteratively.
Visual Example:
# Using the same graph as before:
graph = {
  'A': ['B', 'C'], 'B': ['A', 'D', 'E'],
  'C': ['A', 'F'], 'D': ['B'],
  'E': ['B', 'F'], 'F': ['C', 'E']
}
# Starting at node 'A'
Input: graph, 'A'
Output: ['A', 'B', 'D', 'E', 'F', 'C']
Note: Other valid DFS paths exist. This one explores A -> B -> D, then backtracks to B and explores B -> E -> F, then backtracks to A and explores A -> C.
Connected Components in a Network
You are given a network of computers represented by an adjacency matrix `isConnected`. If `isConnected[i][j] == 1`, then the `i-th` and `j-th` computers are directly connected. A group of directly or indirectly connected computers is a "component". Return the total number of connected components in the network.
Example:
Input: isConnected = [[1,1,0],[1,1,0],[0,0,1]]
Output: 2
Data Analysis Question
Analysis of the Iris Dataset
Using a data analysis library like Pandas in Python, perform the following tasks on the Iris dataset.
1. Load Data: Load the Iris dataset from this URL: 'https://raw.githubusercontent.com/mwaskom/seaborn-data/master/iris.csv'
2. Grouped Analysis: Group the data by the 'species' column. For each species, calculate and display the average `petal_length`.
3. Filtering: Create a new DataFrame that contains only the `virginica` species whose `sepal_width` is greater than 3.5. Display this new DataFrame.